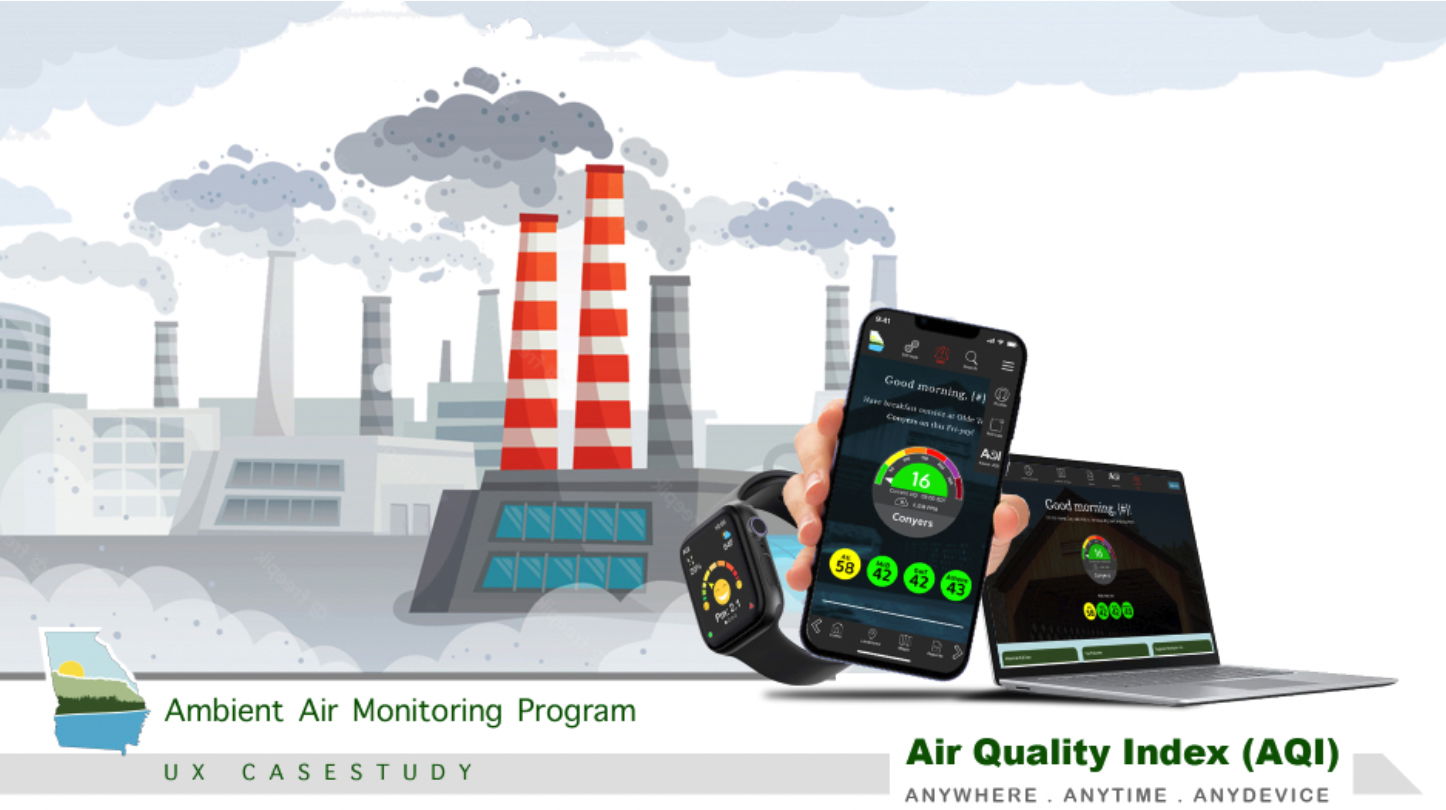
USE CASE: Georgia Air Monitoring System - Air Quality Index
Team Members: Kailas Pramodh, Lisa Moss, Stanley Foster, and Rachel Robocker
Project Title: The O2 Project Nonprofit
Name/URL: Georgia Air Monitoring
Requirement: Research, enhance User experience https://airgeorgia.org/
My role: User Research | Conduct User Interviews | Build Sitemaps | User Flow diagrams, | Competitor Analysis | Usability test | Build style tile and Guides | Hi-Low Fidelity prototyping /wire framing | Wearable Prototype using Figma
Facts Today: Georgia’s net greenhouse gas emissions would fall from 156.5 million tons in 2005 to 79 million tons in 2030 if the state implemented the solutions “at an achievable pace.” In 2020, the state’s emissions were estimated at 122 million tons.
We know that limited access to the air quality index (AQI) and lack of knowledge can lead to health infections among adults and infants. We believe that allowing information to be accessible across multiple devices, creating a subscription option and daily notification system for students majoring in environmental studies, asthmatics, and environmentalists will help them have the most updated information on the air quality index at any point in time
Summary, Design and Approach
Research Phase:
- Content Analysis:
- Conducted a thorough content audit to evaluate the comprehensibility of the AQI data and its presentation.
- Identified gaps in content, including real-time AQI updates and location-based information.
- Design Challenges:
- Analyzed existing design challenges, such as cluttered data presentation and lack of user engagement.
- Discovered issues with the current mobile design's responsiveness and accessibility.
- Navigation Challenges:
- Explored navigational difficulties within the website, including difficulties in finding the AQI section, understanding the data, and interpreting air quality reports.
- User Research:
- Conducted surveys and interviews to gather user feedback on the current AQI content, website usability, and potential interest in wearable solutions.
- Identified user preferences and expectations for air quality information.
Key Findings:
- Content Enhancement:
- Users expressed a desire for real-time AQI data, localized information, and actionable insights regarding air quality.
- Design Optimization:
- Users found the current design visually overwhelming, and the responsiveness on mobile devices was suboptimal.
- Navigation Improvement:
- Users faced difficulties locating the AQI section, which often led to frustration and site abandonment.
- Competitor Analysis:
- Competitors provided more engaging AQI content and offered mobile apps and wearable solutions for air quality monitoring.
Proposed Solutions:
- Content Improvement:
- Enhance the AQI content with real-time data and location-based information.
- Provide actionable tips for users based on air quality levels.
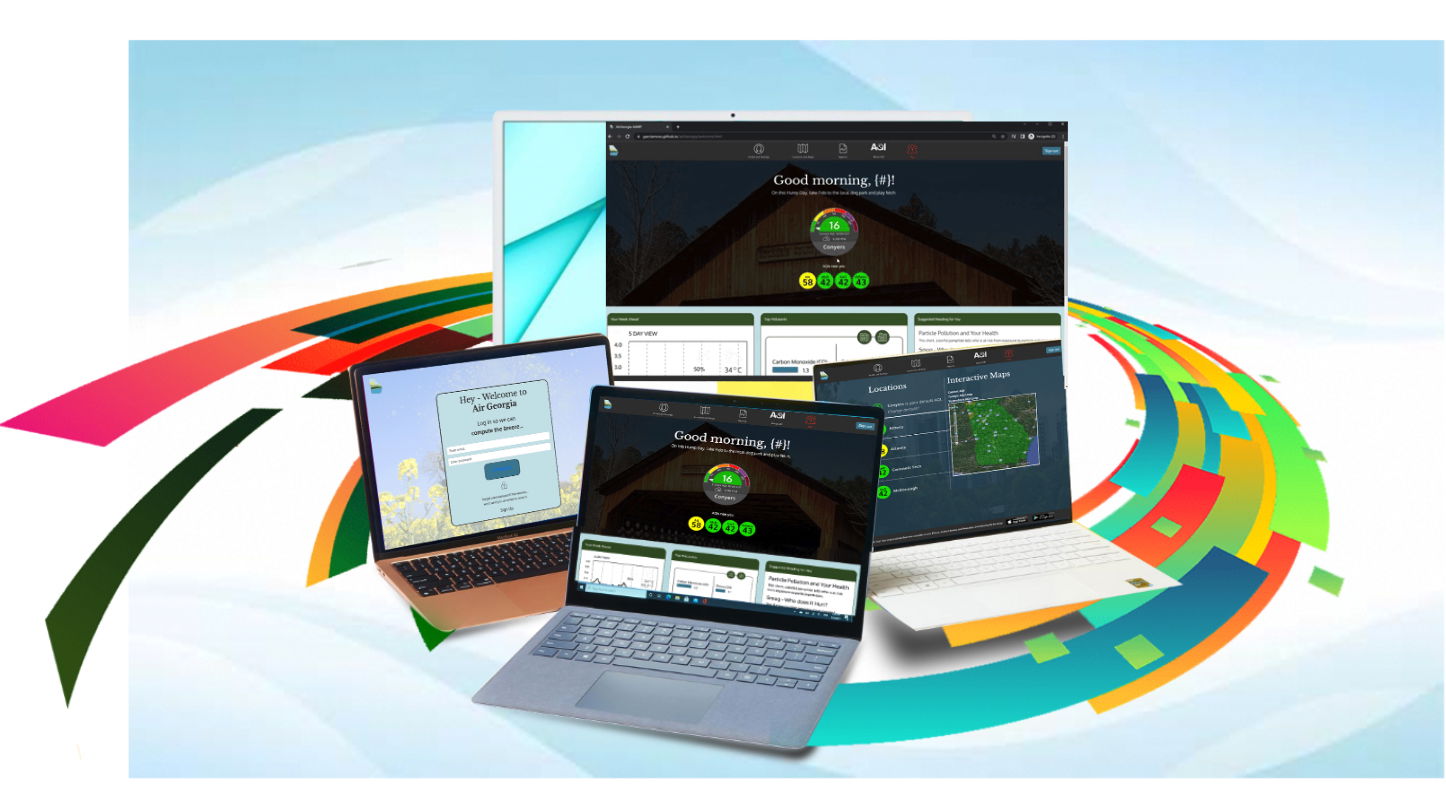
- Design Optimization:
- Redesign the website for improved user engagement and mobile responsiveness.
- Implement an accessible and aesthetically pleasing AQI section.
- Navigation Enhancement:
- Simplify website navigation to make the AQI section easily accessible.
- Include clear call-to-action buttons for AQI information.
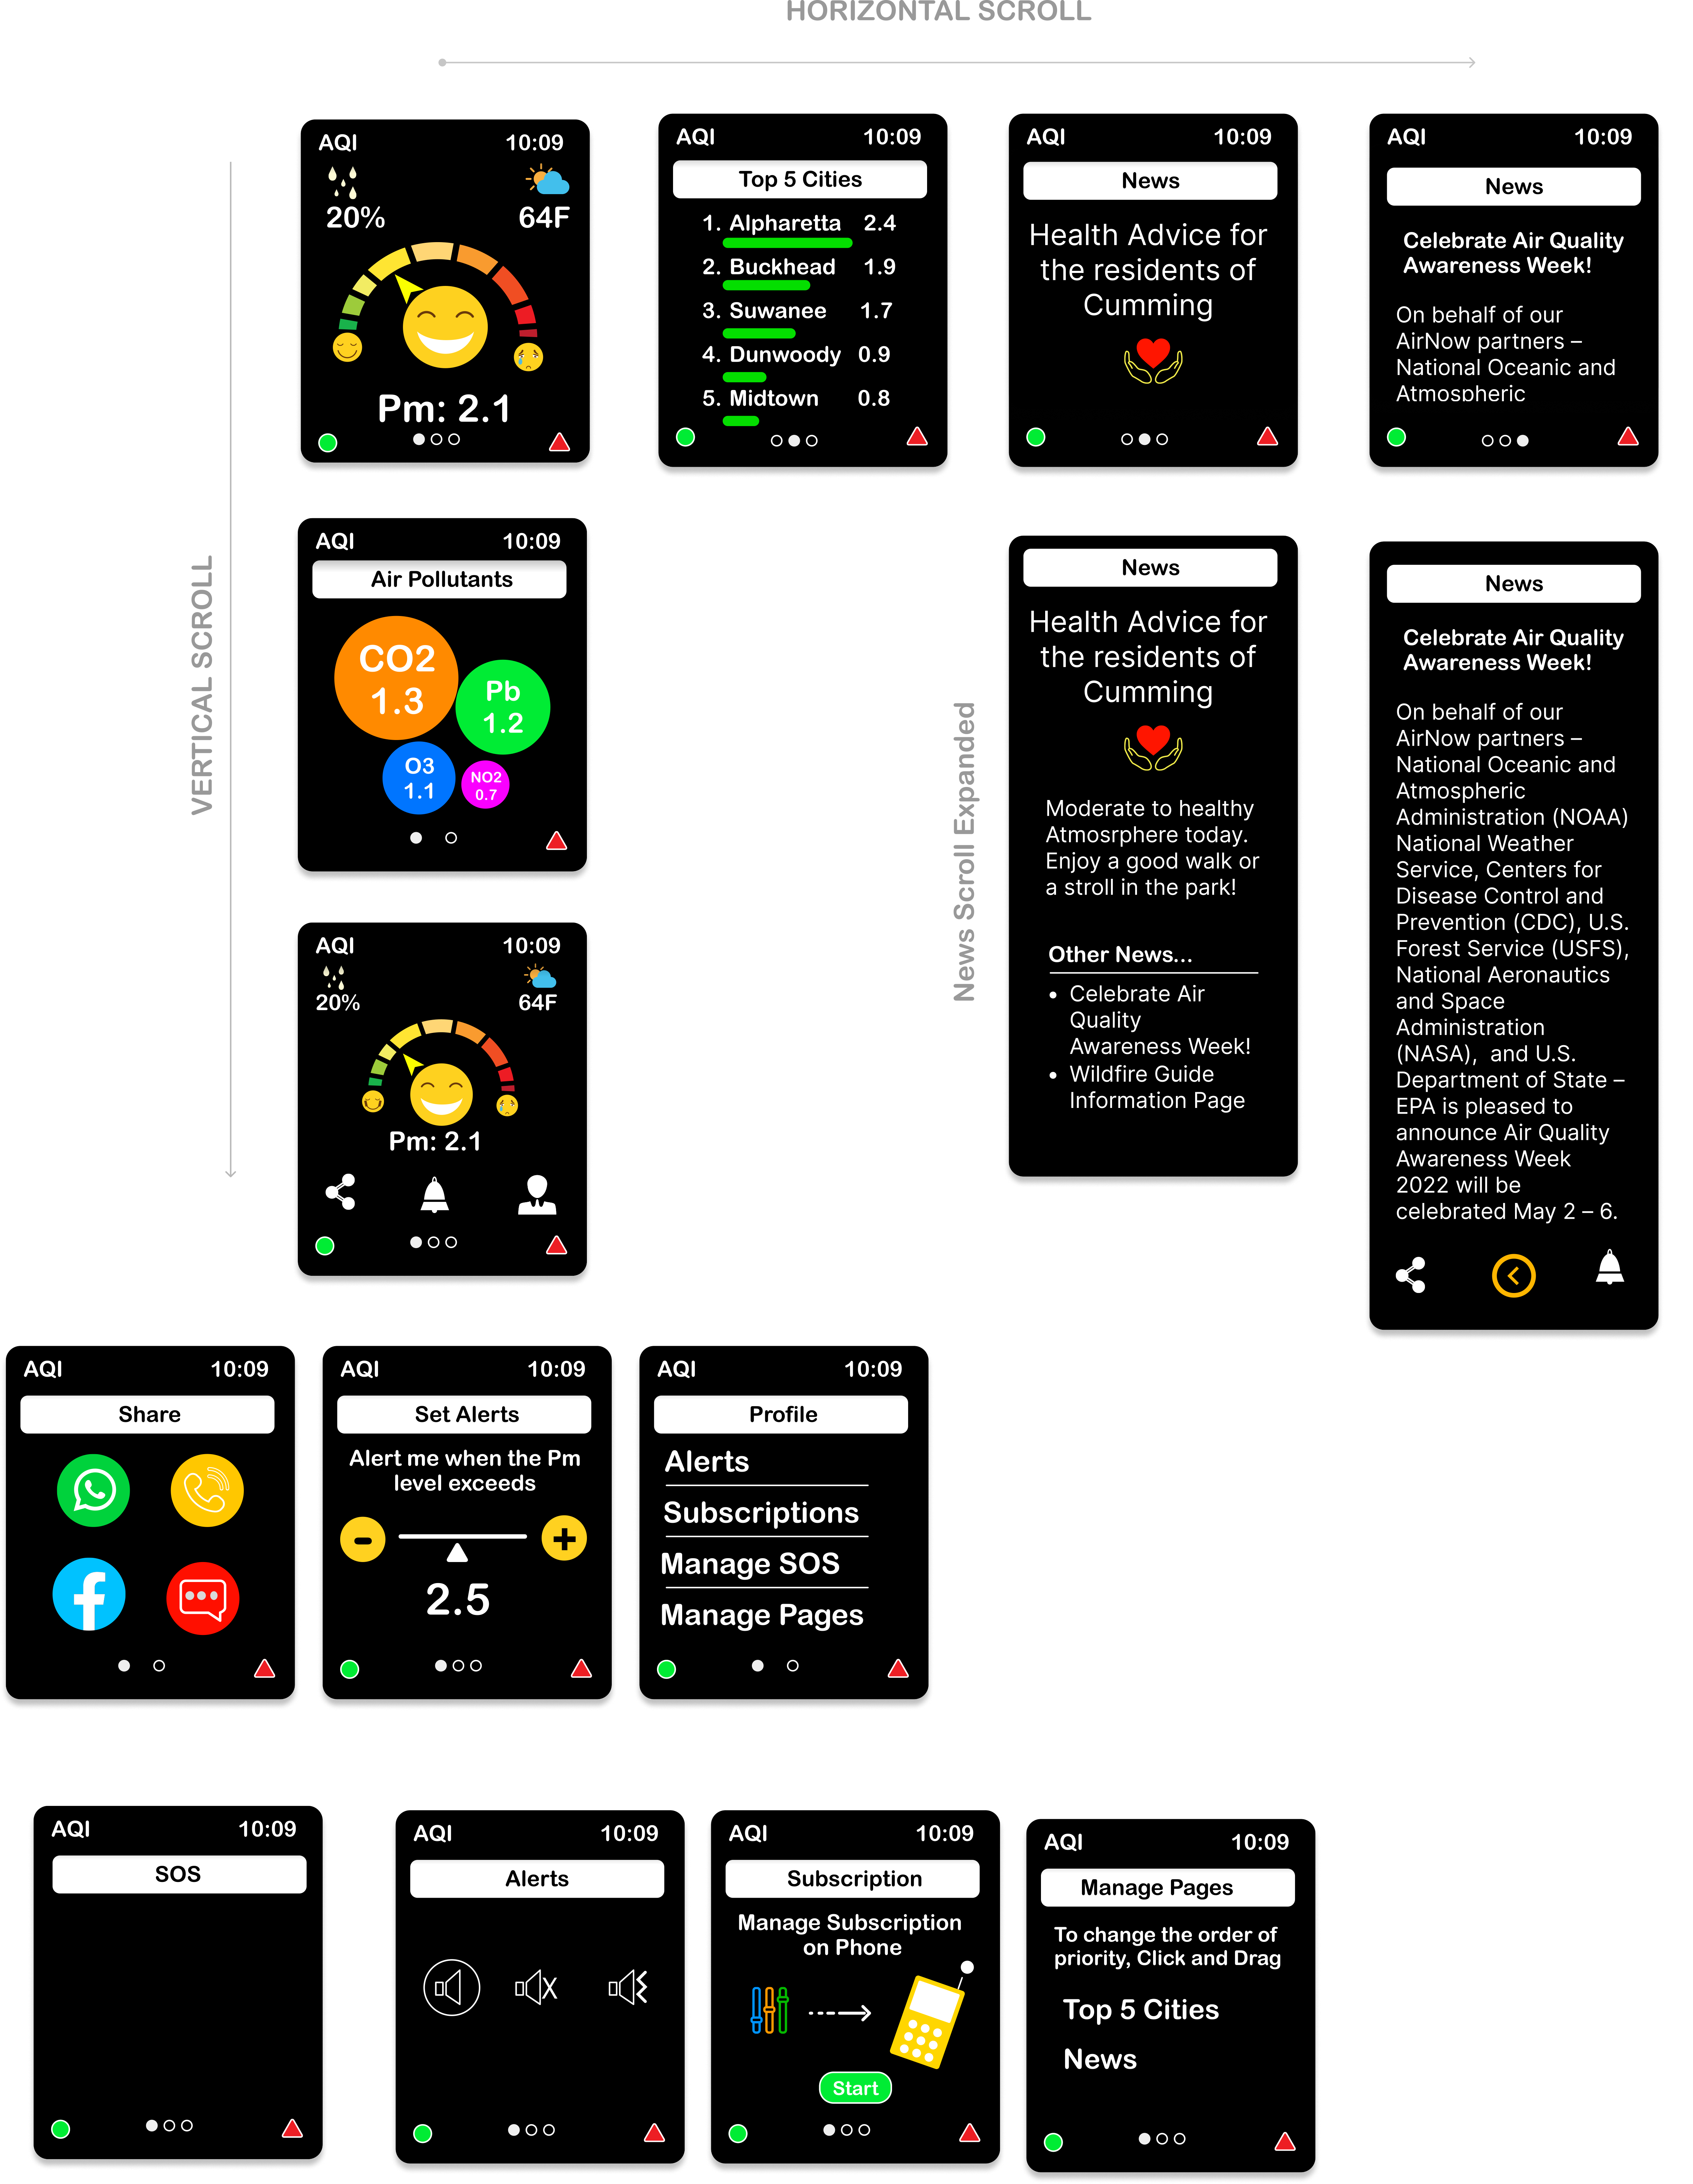
- Wearable Solution - Apple Watch:
- Develop a unique Apple Watch app that allows users to monitor air quality in real-time.
- Ensure seamless integration between the website and wearable app for a cohesive user experience.
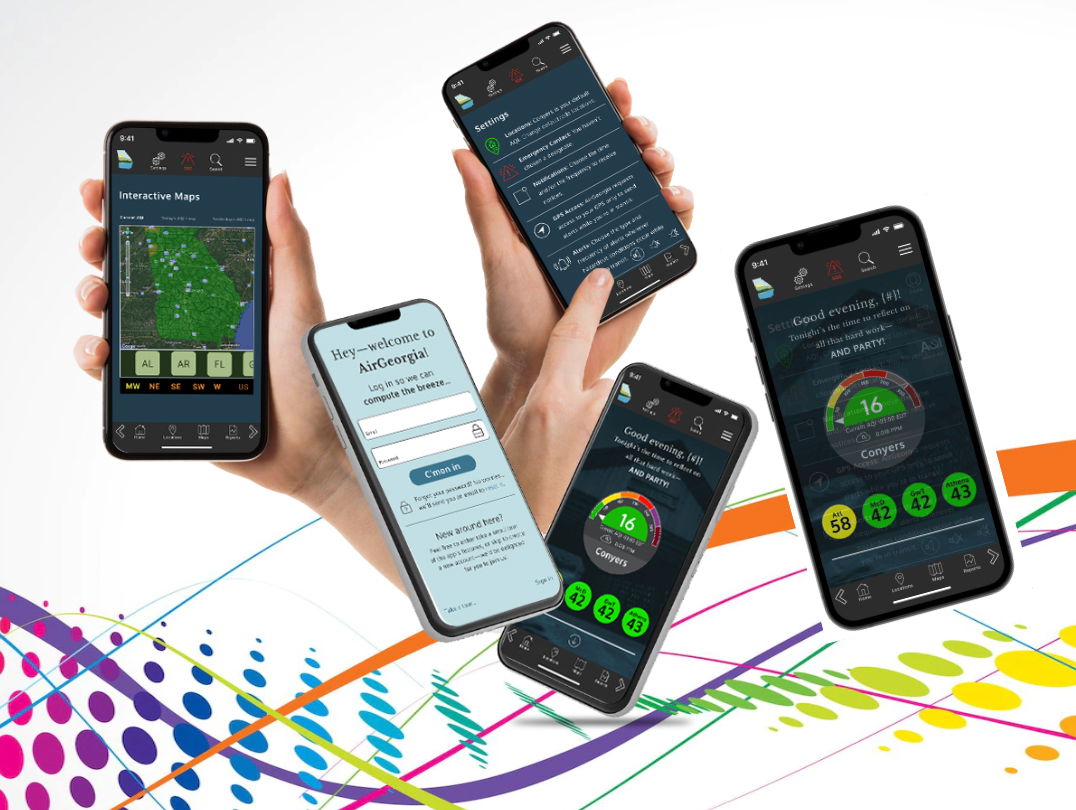
Final Designs
Mobile
Wearable
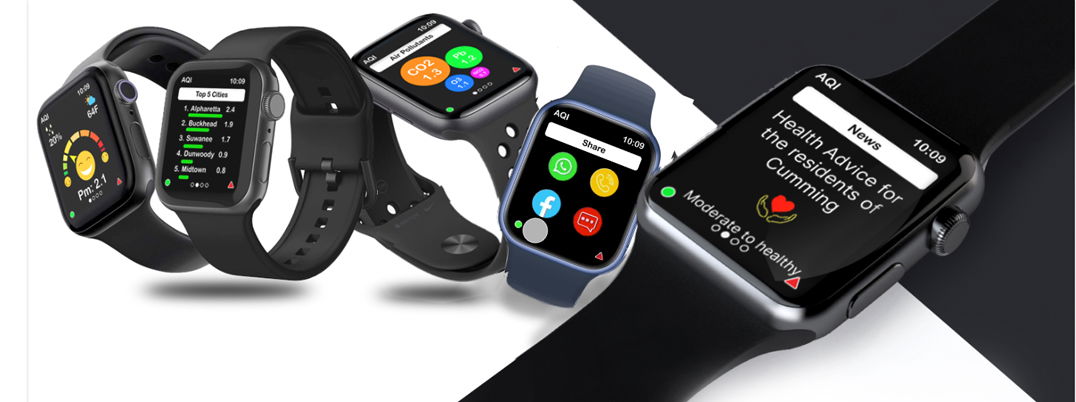
Wearable Design by screen